Solutions For Budgeting & Administration

Utility cost management that runs itself

Budgeting and administrative staff are responsible for ensuring that utility costs are under control. Enpira manages the data, catches errors, and keeps information organized so your team has accurate utility cost information — and without manual effort.

Why Budgeting & Administration Teams Use Enpira

Less time on utility data, more time on everything else

Managing utility accounts across a large portfolio means tracking hundreds of bills, rate changes, account numbers, and vendors. Enpira centralizes all of the data, automates routine work, and generates budgets in seconds.

A blue line-art icon of a desktop computer screen featuring interactive data visualizations, including a three-slice pie chart and a four-bar vertical graph.

One Place for Every Account

Every utility account, meter, and charge — across all facilities and commodities — managed in a single platform.

Blue line-art icon of a bar chart with a trend line and a dollar sign, representing financial data and budget forecasting.

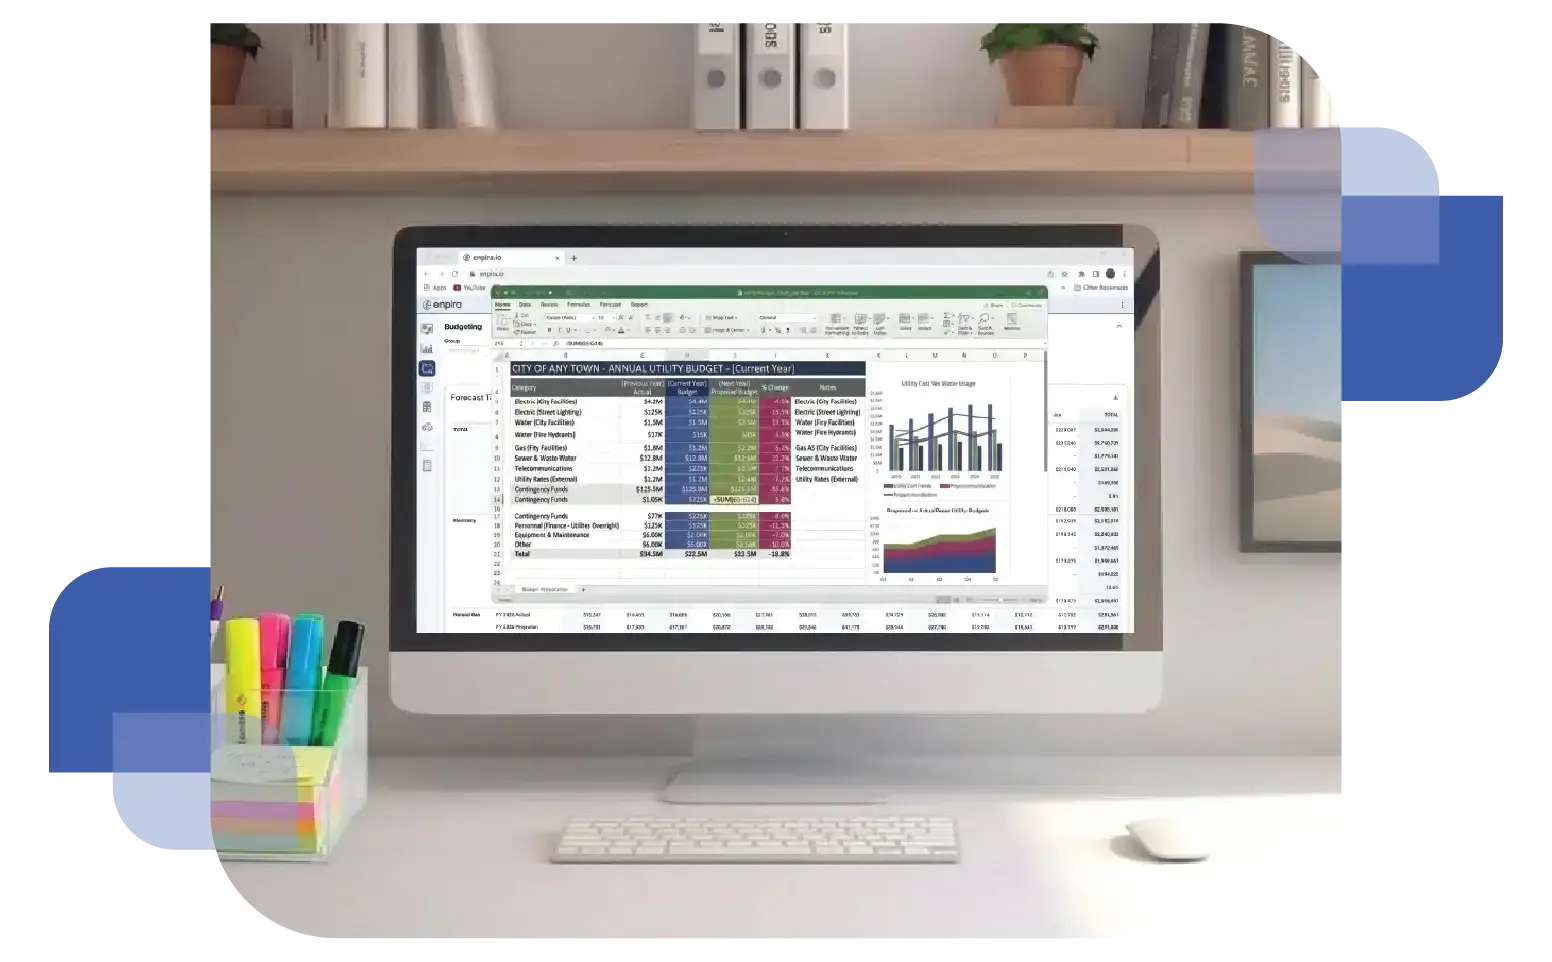
One-Click Budget Creation

Perform on-the-fly budget simulations to fast-track your budgeting process and simplify budget creation.

Two overlapping document sheets featuring a dollar sign and horizontal text lines. A small gear is positioned at the bottom right to represent customization settings.

Reports Ready When Needed

Whether it's a budget summary, a board update, or a department breakdown, Enpira has your data organized.

A digital mockup featuring a laptop and tablet displaying the Enpira platform interface, which includes various colorful data visualizations, bar charts, and utility management dashboards and a detailed budget.

Cost Management & Control

Stay on top of your utility budget without digging through bills

Utility costs are one of the largest line items in an operations budget. Enpira provides clear, organized visibility into how money is being spent — and helps catch surprises before they become budget overruns.

A blue line-art icon featuring four vertical bars of varying heights next to a circular coin symbol with a dollar sign, representing financial data and energy costs.

Cost Tracking by Facility, Department and Commodity
Break down utility spending any way your organization needs, to support budget planning, cost allocation, and variance reporting.

A blue line-art icon of a balance scale, with one dollar sign in the left pan and another in the right, representing financial comparison or rate simulation.

Rate Optimization
Enpira monitors your rate schedules and proactively identifies opportunities to reduce costs through rate switching — savings that go directly to your bottom line.

Blue line-art icon of a document featuring a lightning bolt inside a shield on the top left, horizontal text lines, and a magnifying glass at the bottom right, symbolizing utility bill auditing and validation.

Bill Auditing & Validation
Utility bills are cross-checked against actual meter readings to catch billing errors, duplicate charges, and rate misapplications.

A digital mockup featuring a desktop computer displaying the Enpira platform interface, which includes various colorful data visualizations, bar charts, and utility management dashboards.

Budgeting & Forecasting

Instant utility budgets, without the legwork

Enpira provides your finance team with a clear, organized view of historical utility cost trends, and the tools you need to create accurate forecasts and budgets.

Historical Cost & Usage Archive
Enpira maintains a complete record of utility costs across every account in your portfolio — giving your finance team the data needed to build accurate projections.

A blue line-art icon showing a stack of documents with a dollar sign, overlaid with binoculars that have a dollar sign and a trend line in the lenses symbolizing budget forecasting.

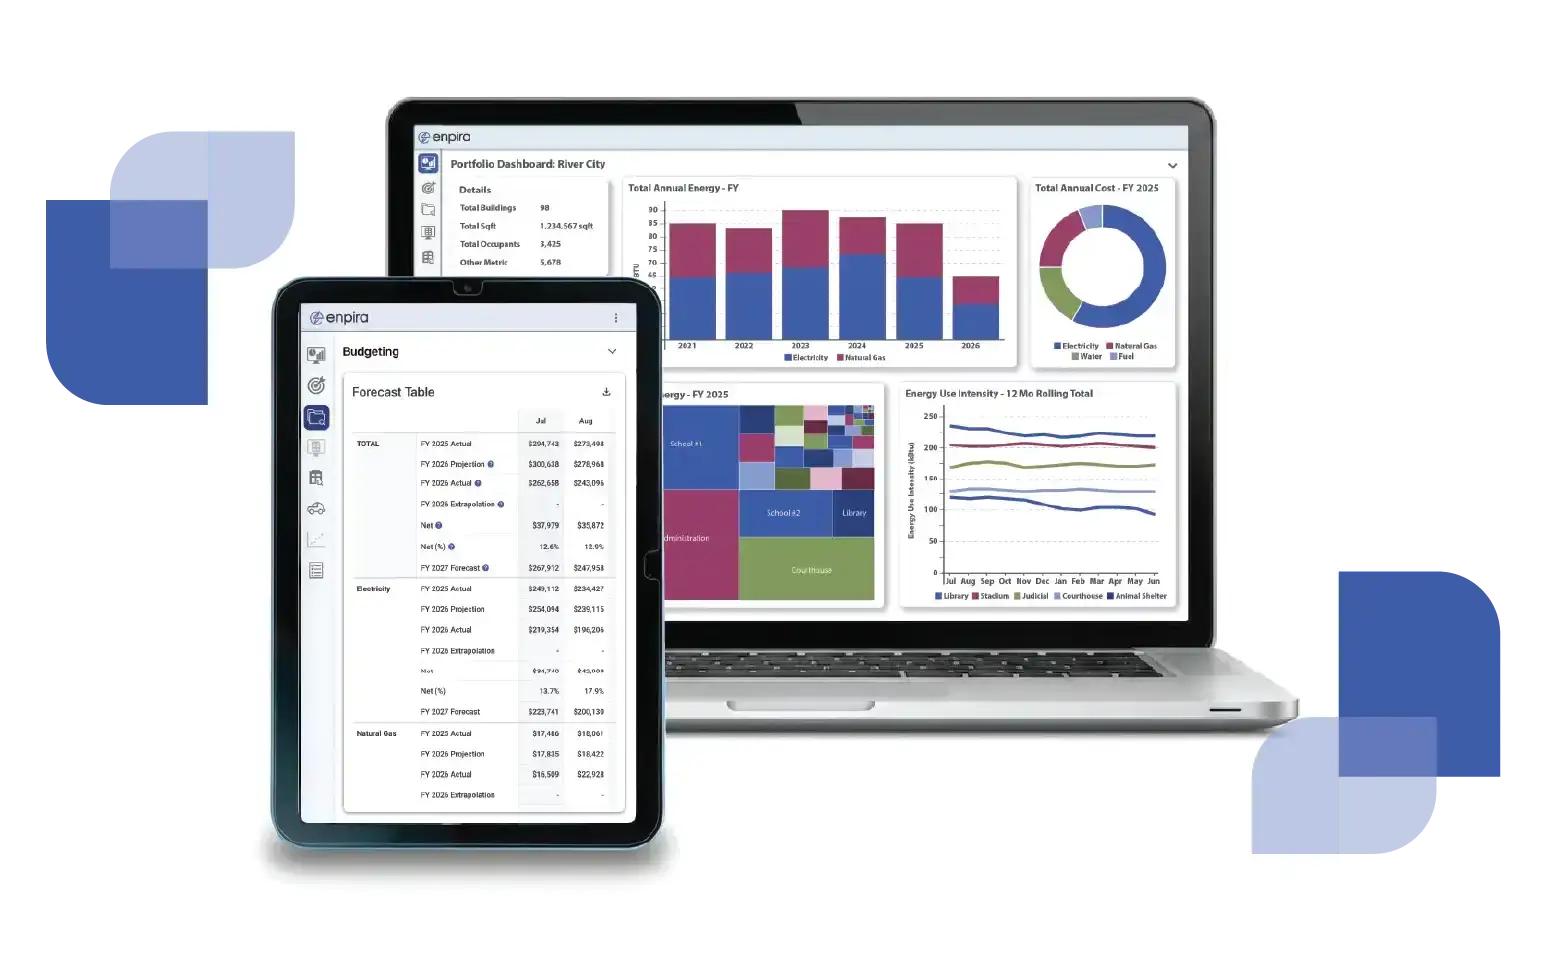
Budget Creation Module
Utilize our budgeting module to create projections and forecasts for any facility or department and for any commodity - electricity, natural gas, or water.

Blue line-art icon of a bar chart with a trend line and a dollar sign, representing financial data and budget forecasting.

Track Performance Against Budget
Leverage Enpira's extrapolation to forecast whether you are on target against your budget, enabling you to revise plans mid-year as circumstances change.

A wooden office desk with a calculator and pen resting on top of a "Monthly Budget" financial document and a computer monitor with a colorful graph representing cost-effective energy planning.

Reporting & Compliance Support

The right numbers, organized the right way

Budgeting and administrative staff are often the ones who pull together reporting for leadership, boards, councils, and external agencies. Enpira keeps everything organized and ready to report.

Two overlapping document sheets featuring a dollar sign and horizontal text lines. A small gear is positioned at the bottom right to represent customization settings.

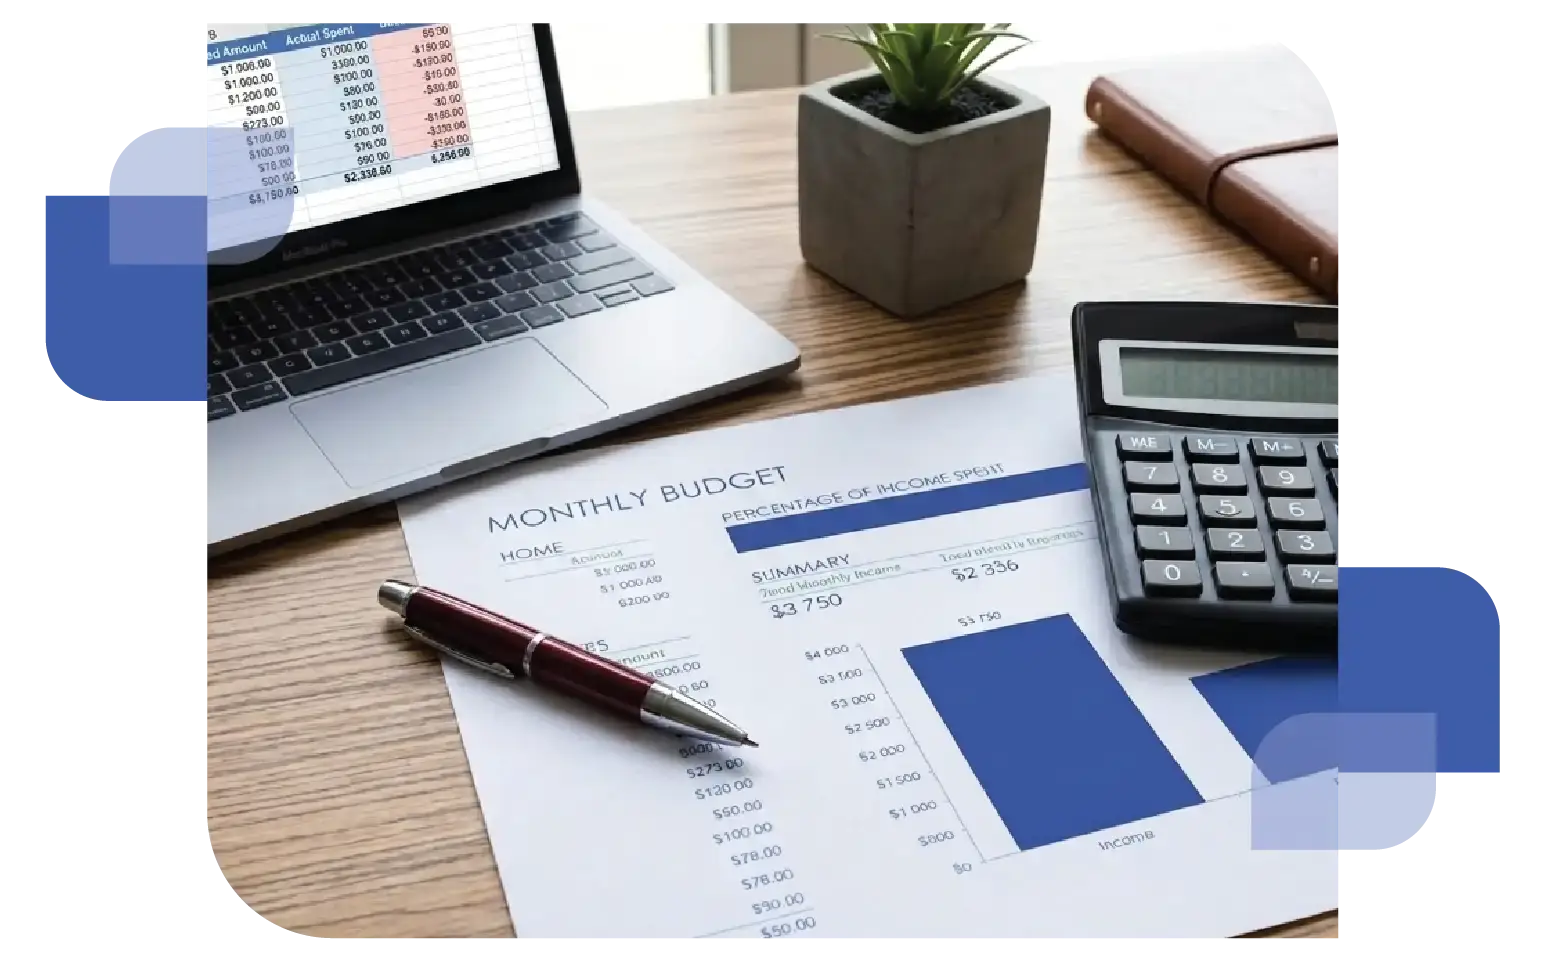
On-Demand Cost & Usage Summaries
Pull clean, accurate utility cost and usage summaries at any time — by facility, by department, or across the full portfolio.

A stylized blue icon featuring a figure giving a presentation on a large screen to three seated audience members, representing professional reporting and communication.

Board & Council Reporting
Enpira prepares biannual utility reports proactively, so there's no last-minute data gathering before reporting deadlines.

A blue line-art security shield containing a bold white checkmark, representing verification and industry compliance.

Compliance & Disclosure Support
For organizations subject to benchmarking ordinances or disclosure requirements, Enpira keeps your data organized and submission-ready.

Take utility data management off your team's plate

See how Enpira handles the complexity of utility data so your budgeting and administrative staff can focus on higher-value work.