Solutions For Sustainability Managers

The data foundation your sustainability program needs

Your sustainability program is only as strong as the data behind it. Enpira works alongside you to make sure your data is accurate, your progress is visible, and your reports are ready when you need them.

Why Sustainability Managers Choose Enpira

Built for the way you work

Enpira gives you a single, managed platform where all of your data comes together, backed by a team that understands what you’re trying to achieve.

A blue line-art icon of a desktop computer screen featuring interactive data visualizations, including a three-slice pie chart and a four-bar vertical graph.

One Home for All Your Data

Electricity, natural gas, water, solar, fleet fuel, and EV chargers — all aggregated into insightful analytics. We do the heavy lifting of keeping your data up to date.

A blue line-art icon showing two overlapping document pages; the front page has a leaf logo and a shield with a checkmark, representing tracked and verified sustainability plans.

Reports Ready When Needed

Generate audit-ready sustainability and ESG reports. Our team compiles and validates the data so you can present with confidence.

A blue line-art icon of a triangle with rounded corners containing a large exclamation mark, representing an alert or notification.

Alerts You Should See

There is energy and cost savings hiding in your data. Enpira identifies high usage, billing anomalies, and savings opportunities you should be aware of.

Overhead shot of a workspace with printed sustainability reports, a smartphone, and a tablet showing a dashboard with the text "ESG" and leaf icons, representing environmental data management.

Planning & Strategy

Turn your sustainability plan into living dashboards

Multi-year sustainability plans are only as strong as the data behind them. Enpira provides visibility into your progress and quantifies the impact of your initiatives.

Two overlapping document sheets featuring a leaf icon and horizontal text lines. A small gear is positioned at the bottom right to represent sustainability tracking settings.

Sustainability Plan Tracking
Quantify and visualize progress against your multi-year Master Sustainability Plan and strategic objectives.

Blue line-art icon of a desktop computer monitor displaying a large leaf, symbolizing digital sustainability reporting.

Clean Energy Project Evaluation
Measure the impact of your clean energy initiatives — solar installations, LED upgrades, building recommissioning, and more.

A blue line-art icon featuring a horizontal bar graph on the left and a simplified building on the right, representing Energy Use Intensity (EUI) data.

Portfolio Benchmarking
Compare energy use across your entire portfolio by facility size, type, and time period to identify outliers and prioritize investment.

A workspace featuring a desktop computer showing the Enpira interface, which includes colorful bar graphs, pie charts, and data tables for tracking energy consumption and sustainability goals.

Compliance & Reporting

Every report — audit-ready, when you need it

Whether you’re meeting local benchmarking ordinances, satisfying state disclosure requirements, or preparing annual sustainability reports, Enpira makes sure your data is accurate, organized, and ready to share.

Local Ordinance & ESG Compliance
Automate your data compilation and report creation to meet your reporting requirements.

A blue line-art icon showing two overlapping document pages with horizontal text lines. The front page features a stylized leaf in the top-left corner and a large magnifying glass in the bottom-right corner, symbolizing a sustainability report or environmental data audit.

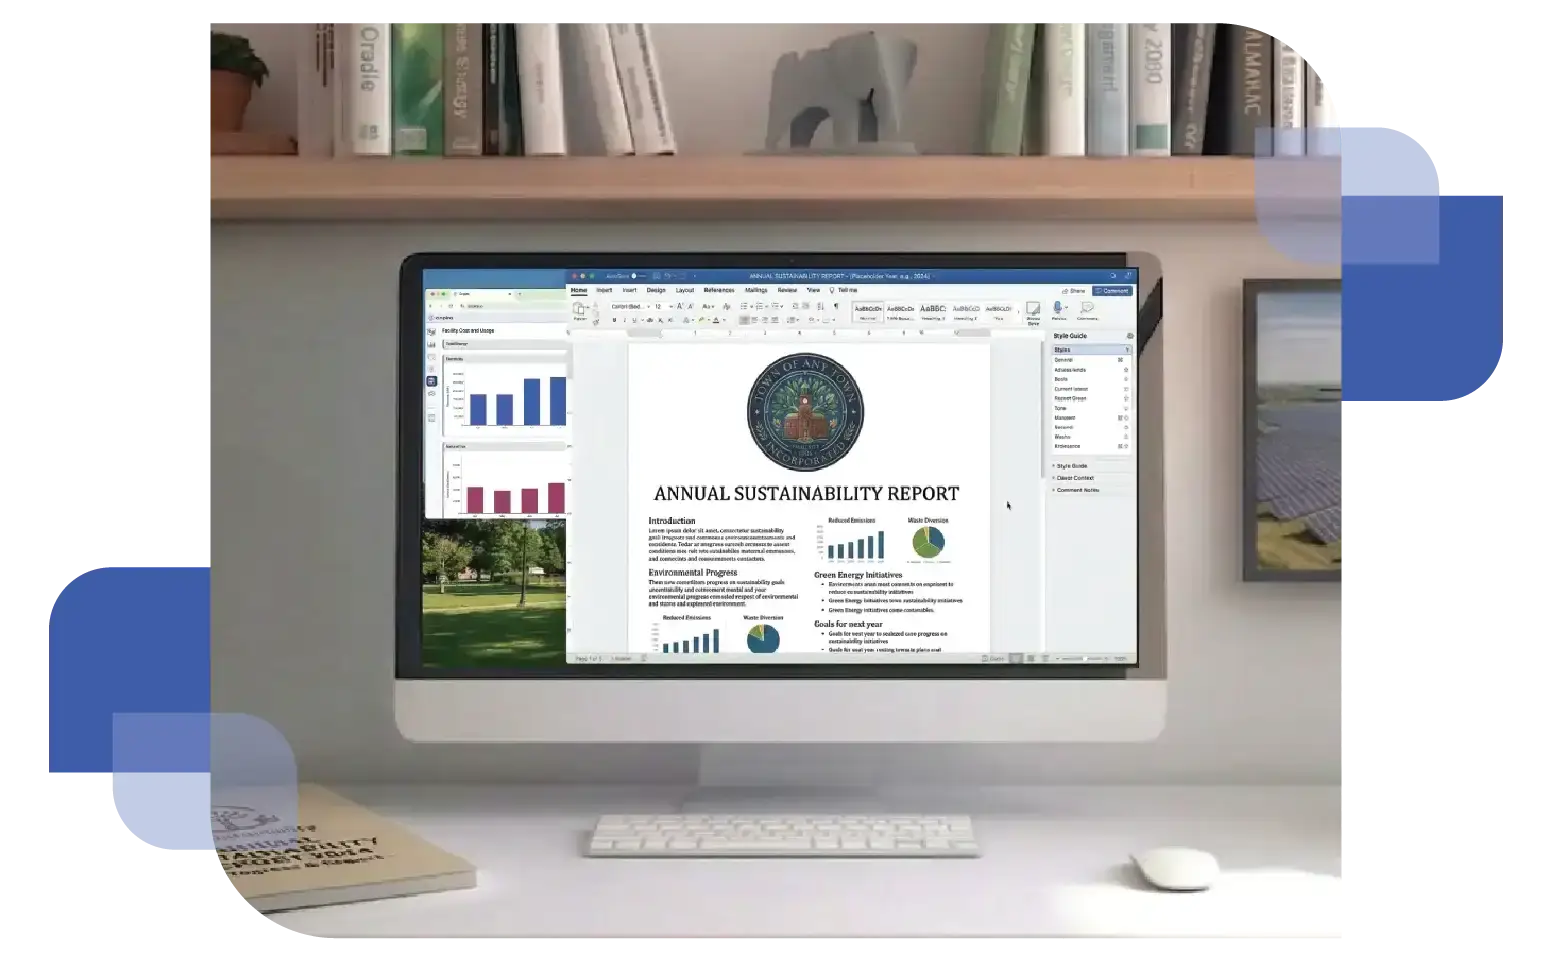
Sustainability Reports
Board presentations, council meetings, annual reports — generate clean, validated summaries, formatted for any audience.

A blue line-art security shield containing a bold white checkmark, representing verification and industry compliance.

Audit-Ready Assurance
Accuracy is a must, and Enpira is ready to explain the sources and methodology behind your numbers.

A laptop and tablet displaying the Enpira interface, featuring bar graphs, pie charts, and data tables that track energy consumption and sustainability metrics.

Emissions & Clean Energy Tracking

Emissions calculations without the manual effort

Enpira automates the calculation of greenhouse gas (GHG) emissions and tracks your GHG footprint over time and across your entire portfolio.

A blue stylized cloud icon containing the chemical formula "CO2" representing carbon dioxide emissions.

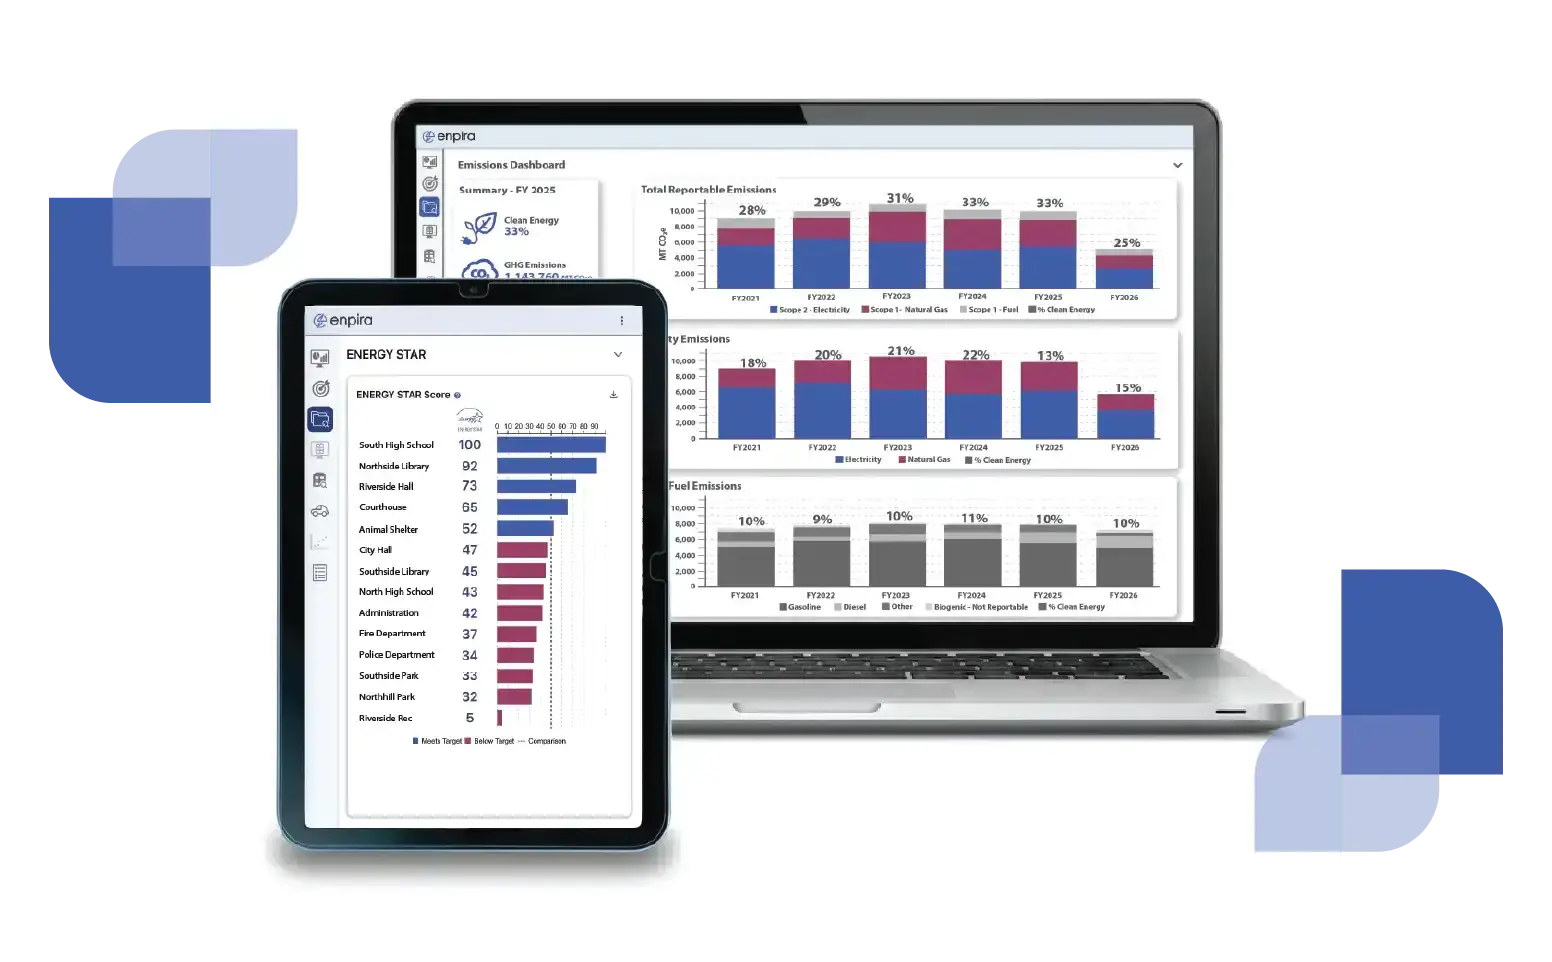
Emissions Footprint Calculation
Electricity, natural gas, and fleet fuel usage are automatically converted into emissions footprint metrics using industry-accepted conversion factors.

A blue line-art icon featuring a stylized leaf where the stem is an electrical plug, representing clean energy and green investment.

Clean Energy Progress
Track the percentage of your energy that is produced from clean and renewable sources.

A blue line-art icon featuring three vertical bars of varying heights, a rising line graph with nodes, and a mechanical gear in the bottom right corner.

Custom Metrics
Bring Enpira your unique sustainability objectives, and we will create attractive dashboards and useful reports.

Let's build your sustainability program together

See how Enpira becomes the data backbone of your sustainability program — so you can spend less time managing spreadsheets and more time delivering impact.